Geospatial Analysis
Geographic information systems (GIS) have become integral to the practice of archaeology. Their use can be grouped into three broad categories: to manage site-level data as well as inventory sites at state and regional levels; to conduct various forms of goespatial analysis (e.g., viewshed analysis); and to make maps and visualize data.

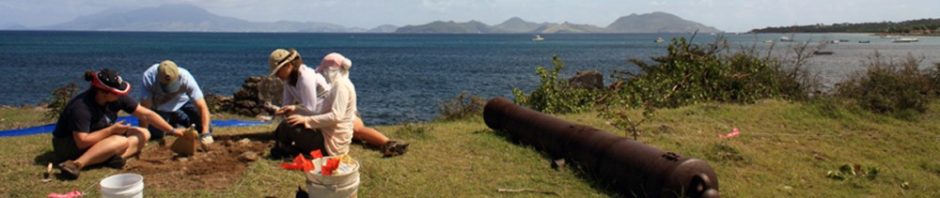
Using GIS to manage archaeological data at the site of Fort Charles (2013).
The use of GIS at Fort Charles includes all the above. The use of GIS during the project planning stage means that every aspect of work includes detailed three dimensional coordinates. This allows us to create site maps for each year of work like the image above.
GIS also supports sophisticated forms of analysis. For instance, cost surface analysis (CSA) calculates the energy required to move through an environment. Archaeologists use this to create least cost paths (LCP), which represent likely routes from one point to another. This takes two forms, a simpler one solely relying on slope (isotropic) and a more complex one that calculates specific measurements, such as time (anisotropic).
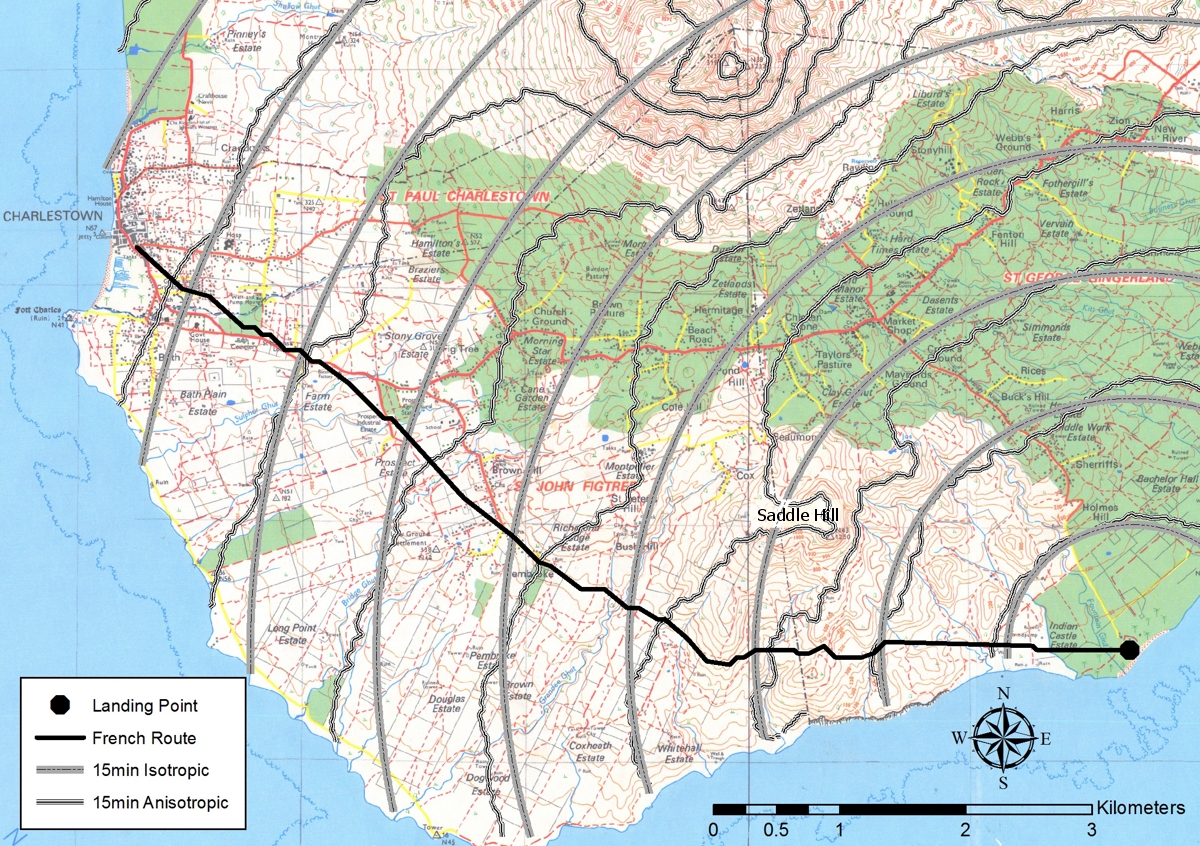
Calculating the route of the 1706 French invasion of Nevis.
CSA helps answer complex historical questions. In Nevis, we’ve used this to analyze troop movements during the 1706 French invasion. French troops made their way to and took possession of Charlestown. Fort Charles, positioned to protect the harbor, was unable to stop this invasion. The above image illustrates the most likely route based on CSA. Importantly, the route bypasses Fort Charles! It is also located to the south of the Saddle Hill fortifications. This analysis suggests one reason why these fortifications were positioned too far inland to defend the coast.
Nevis provides an excellent laboratory for testing different forms of geospatial analysis as well. The selection of data can produce radically different derivative data, which impacts the quality of analysis. This is illustrated with visibility analysis, a type of analysis providing archaeologists with a way to model cognitive and experiential aspects of past landscapes. In other words, a mathematical method for determining what areas of a landscape are visible from a single point, and vice versa.
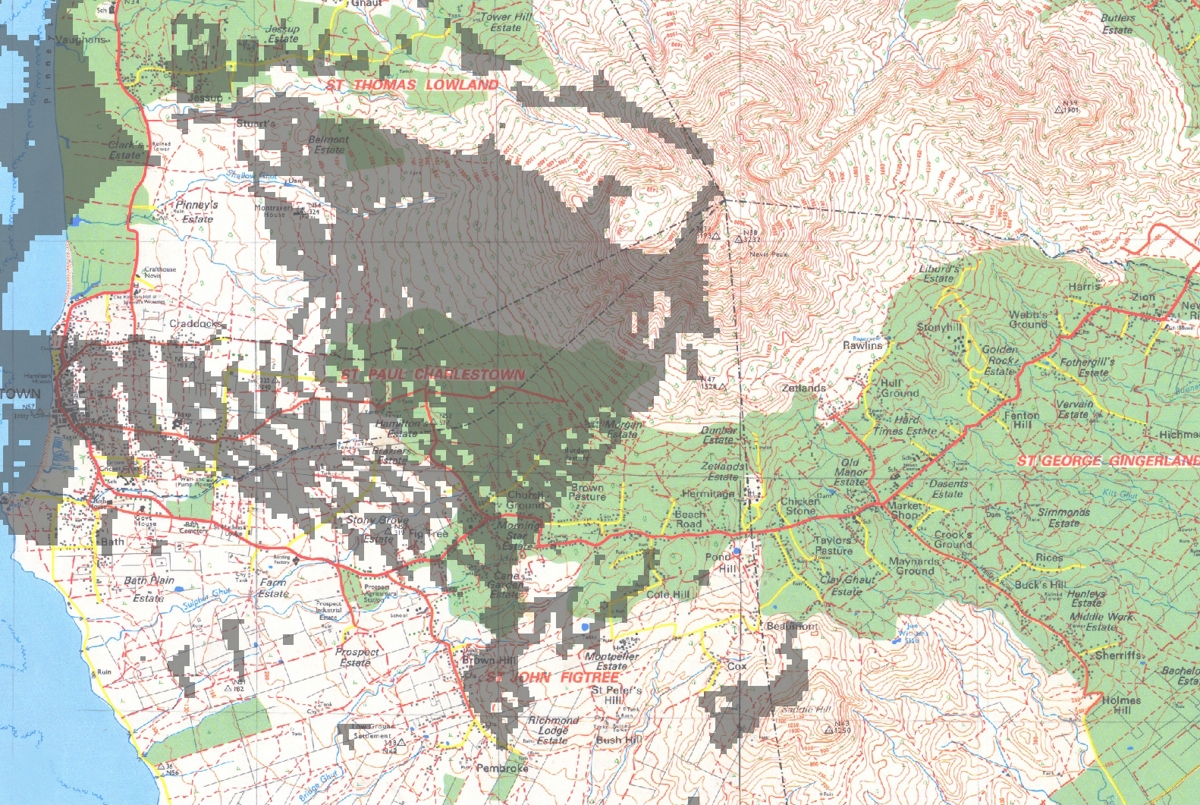
Visibility analysis of Fort Charles using digitized contours from a British Ordinance Survey map.
The above map uses poor quality data, contours that were digitized into a GIS file. The resulting viewshed (shaded in grey) shows the areas visible from Fort Charles. The banding is sometimes referred to as “tiger stripes” are an artifact of this poor quality data.
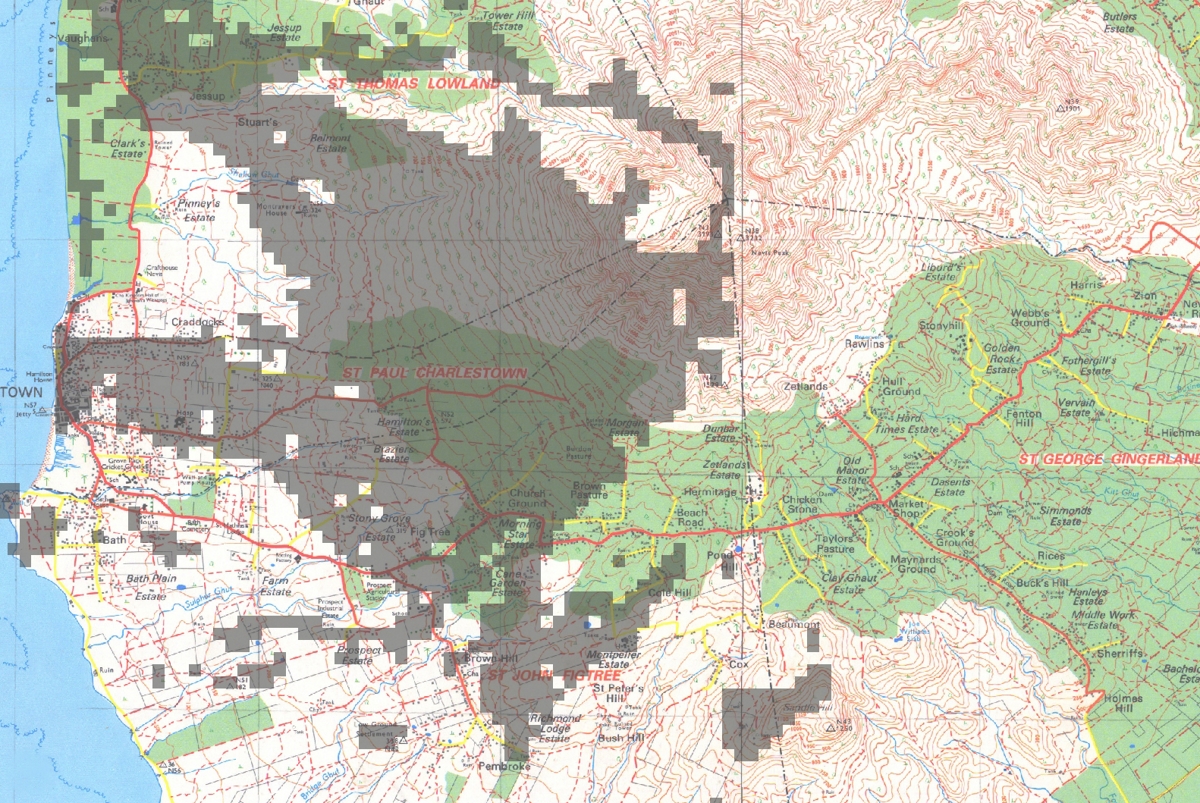
Visibility analysis of Fort Charles using USGS 30m DEM data.
The above map uses higher quality data to calculate the viewshed from Fort Charles. The banding is absent and the areas shaded in grey more closely matches observations taken on the ground. In this case, visibility helps to further illuminate troop movements discussed above, but also the placement of additional military sites around Nevis through time.
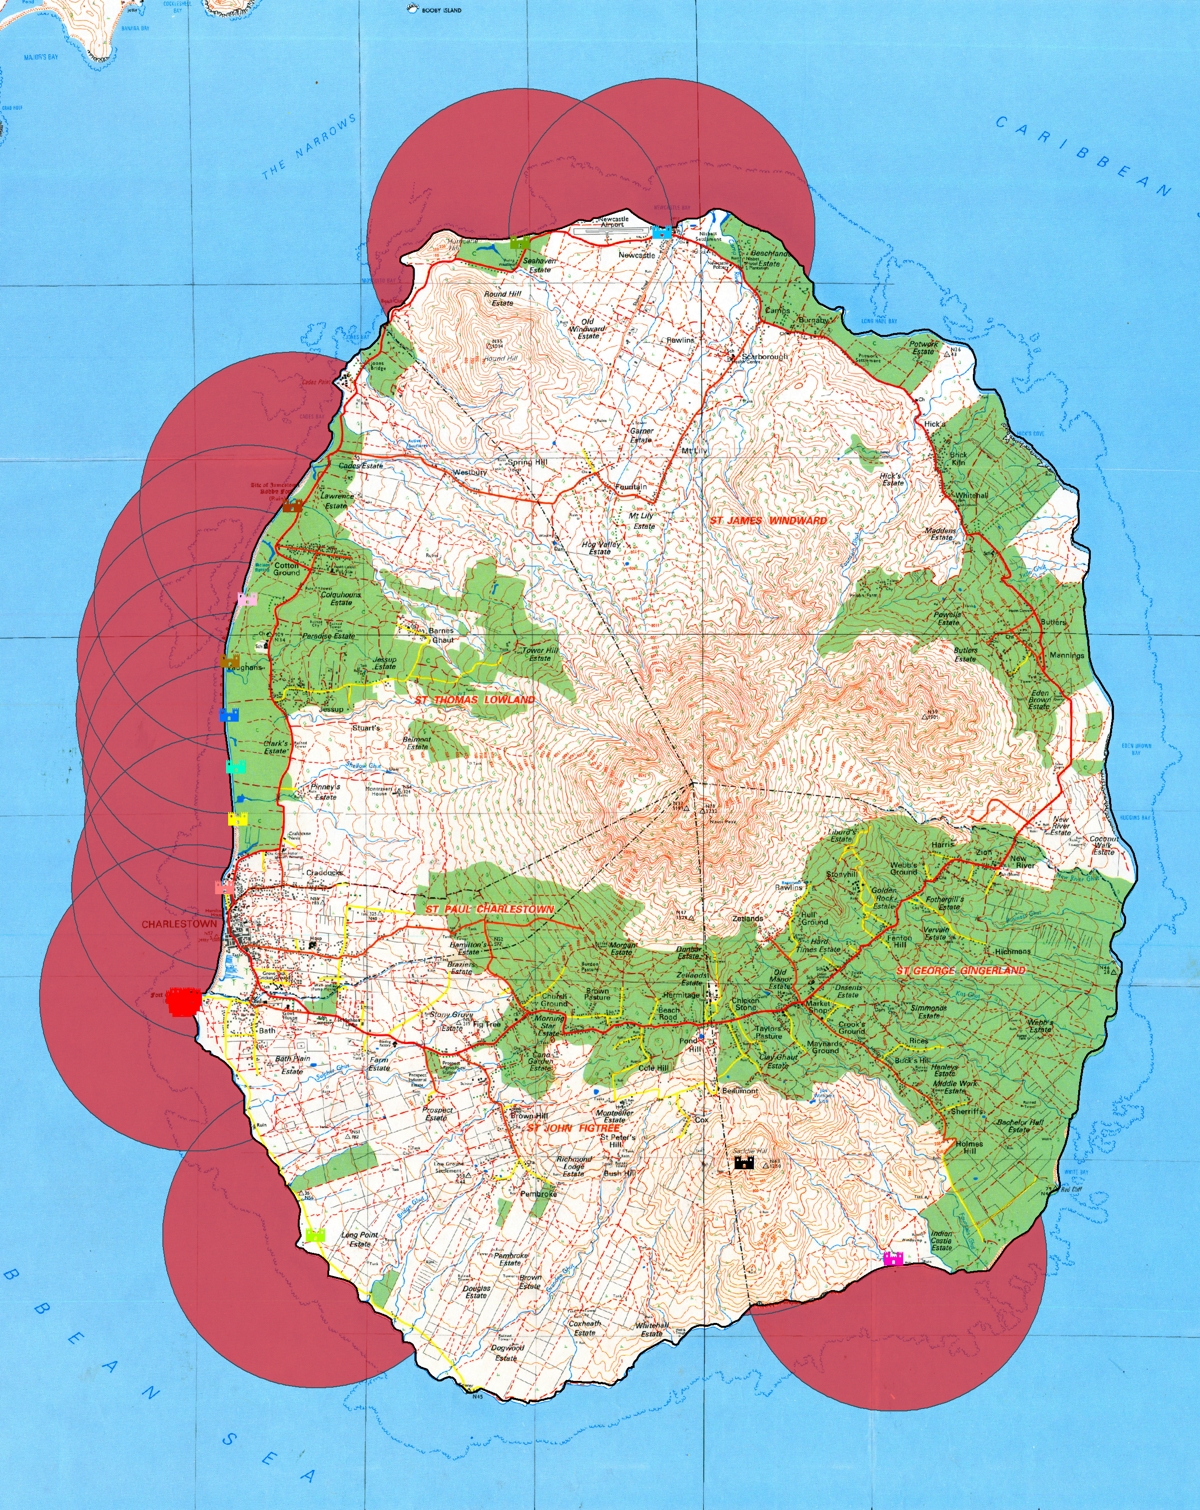
Using GIS to estimate cannon ranges for each of Nevis’ historic forts.
Future geospatial analysis work centers on analyzing the entirety of Nevis as a single military landscape, among other things.